India at the forefront of cashless transactions but wide disparity between States
Bikram De
Post On > Dec 20 2021 2606
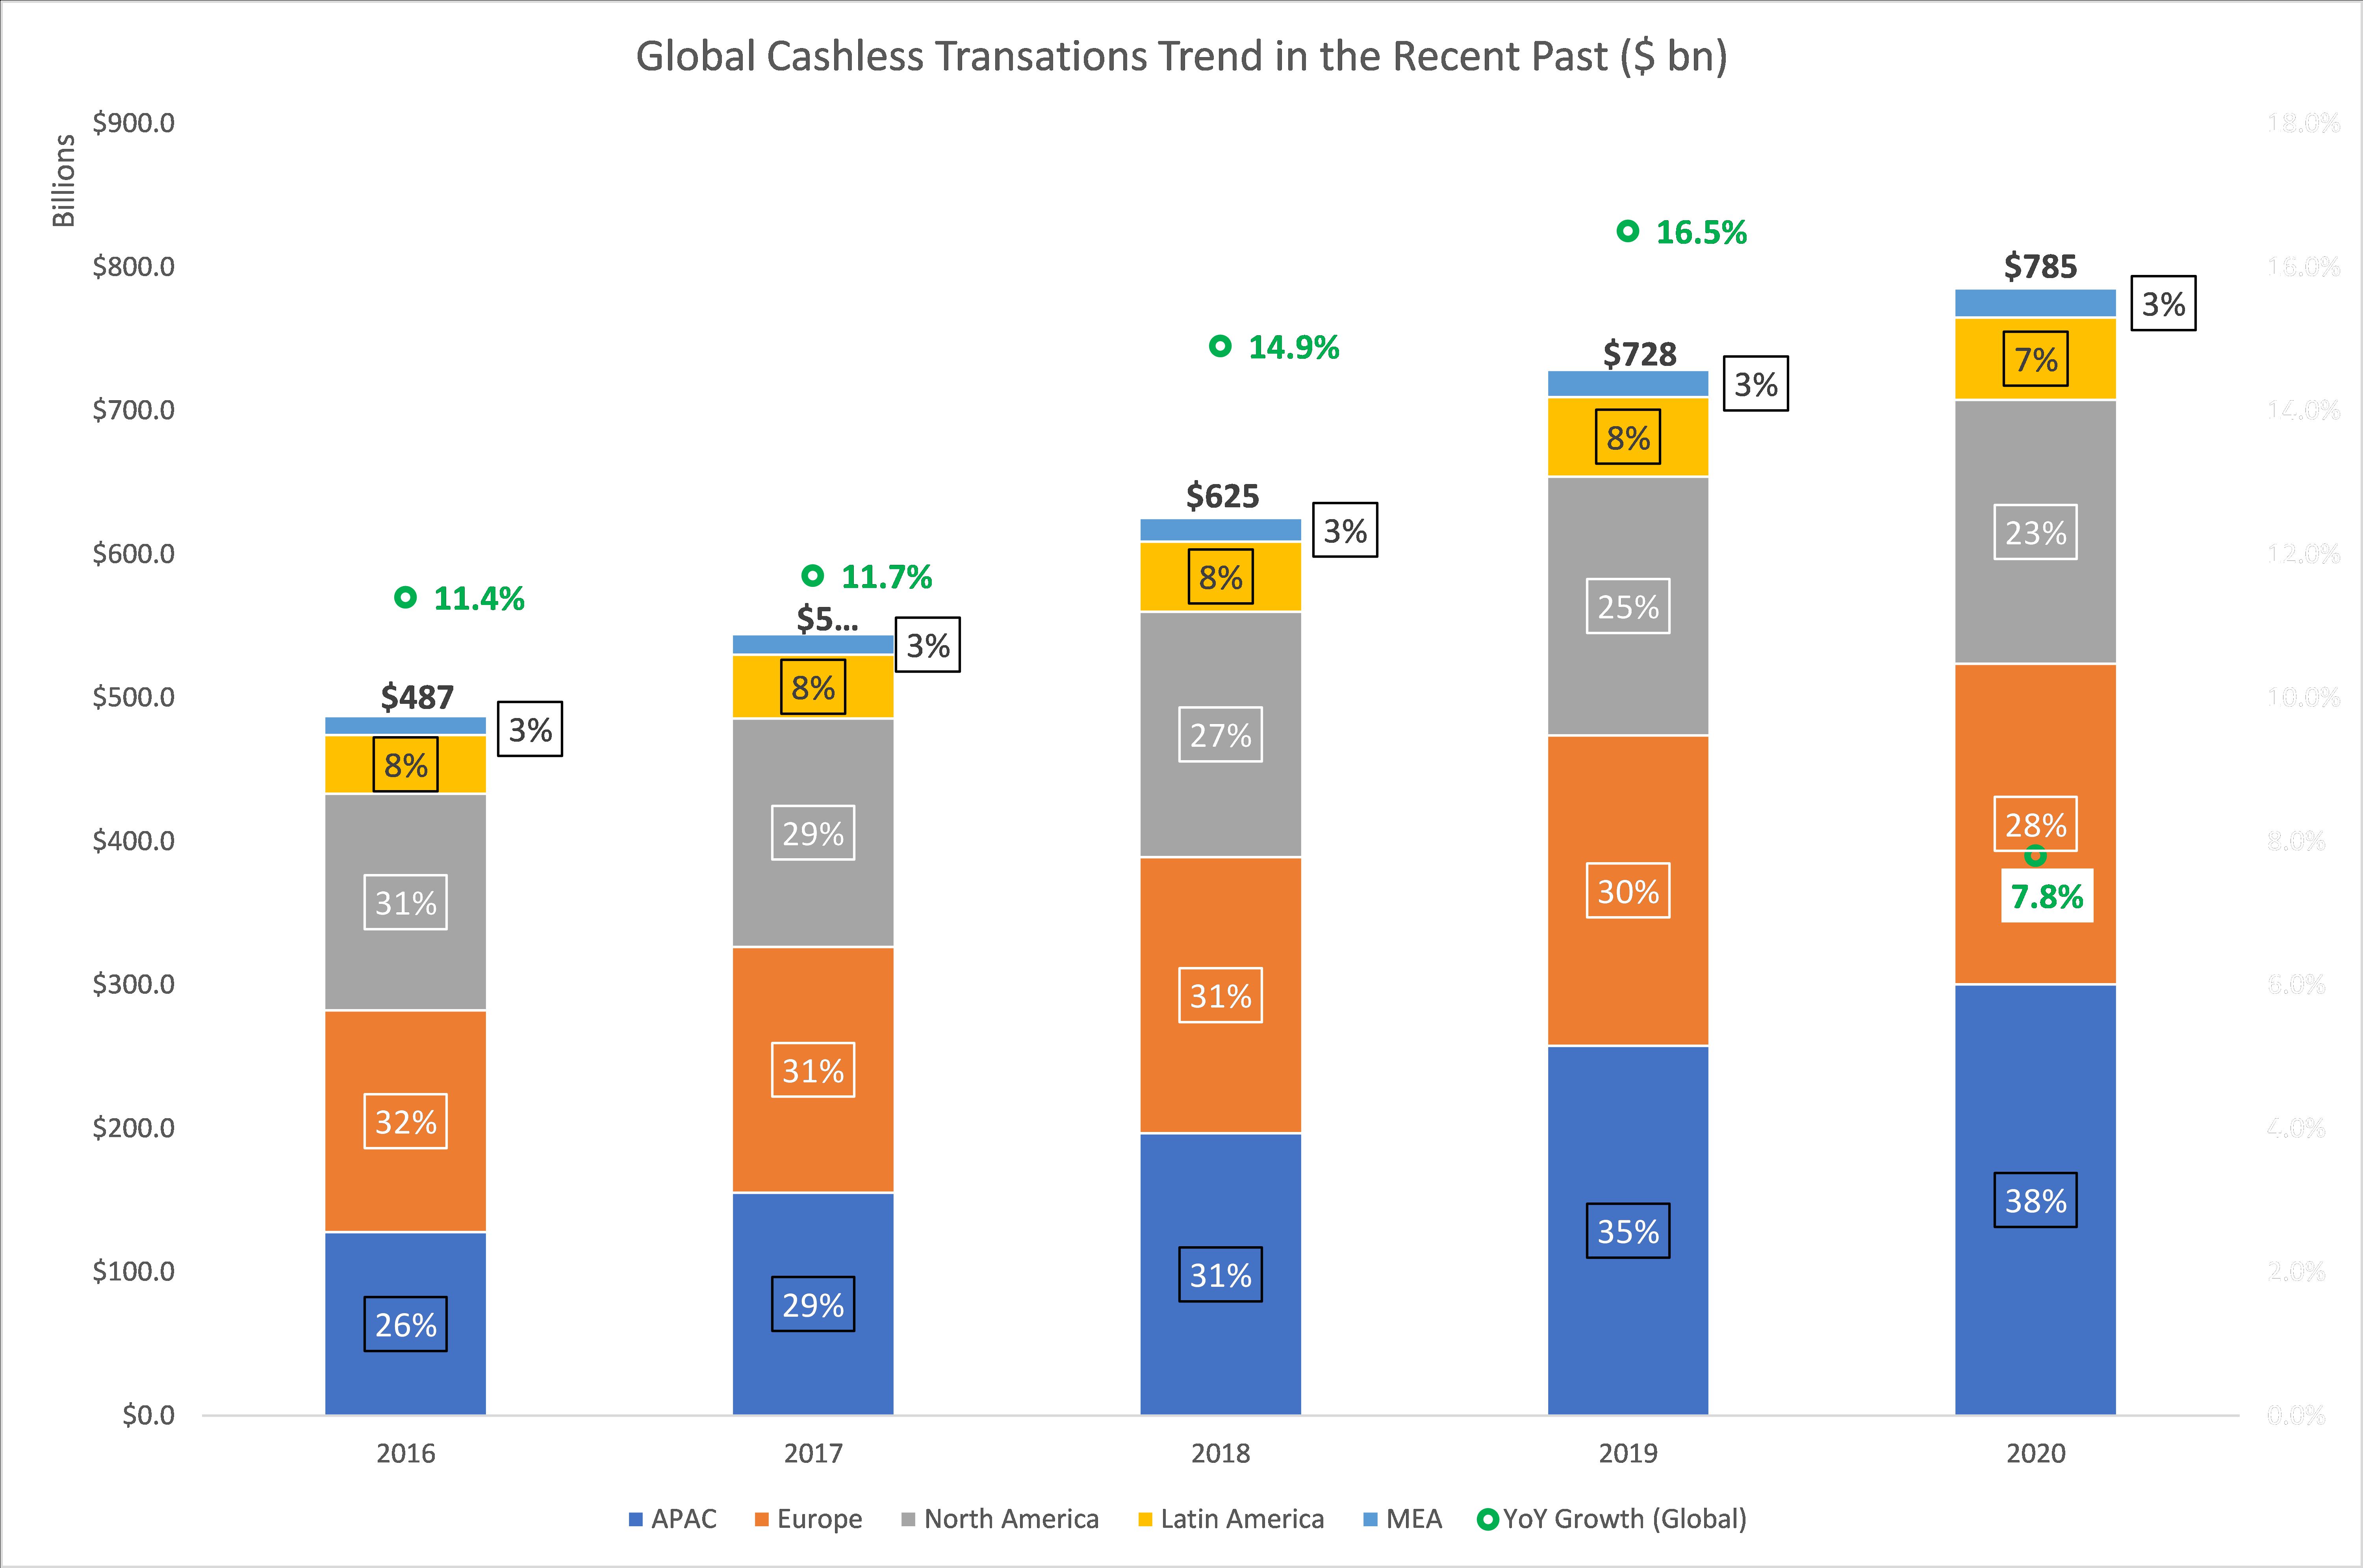
Globally there is a move towards cashless transactions. In the past, it was limited to a particular set of sectors and users. The ongoing Pandemic has ensured that the penetration of digital payment methods and platforms becomes more inclusive. According to Capgemini, during 2016 – 2020, non-cash transactions grew at a CAGR (compound annual growth rate) of 12.7% globally. Non-cash transactions are projected to go up to $1,842.2 bn by 2025 bringing the CAGR for the 2020 – 2025 period to 18.6%.
Exhibit 1 points out that global non-cash transactions have been growing at a steady pace since 2016. The overall growth suffered in 2020 slowing down of economic activity during the pandemic. The share of non-cash transactions contributed by some of the major economic regions of the world went down. However, despite the challenges in economic activity, the share of non-cash transactions in Asia-Pacific (APAC) saw a significant rise.
Explaining this phenomenon is difficult. Industrially laggard West Bengal (3.2 transactions/capita/year) is distinctly behind its immediate neighbour Odisha (5.3 digital payment transactions/ capita/year) that too with a distinctly inferior internet penetration (Exhibit-7). Tamil Nadu is a top State in terms of internet penetration but below average in digital payment. Education is no benchmark either as Tamil Nadu and West Bengal both have large pools of educated populations.
Apparently, some States have a higher affinity to cash than others and/or some people are less comfortable in using digital payment options. It needs deeper study to correctly ascertain the reasons.
Exhibit 1
Source: Capgemini
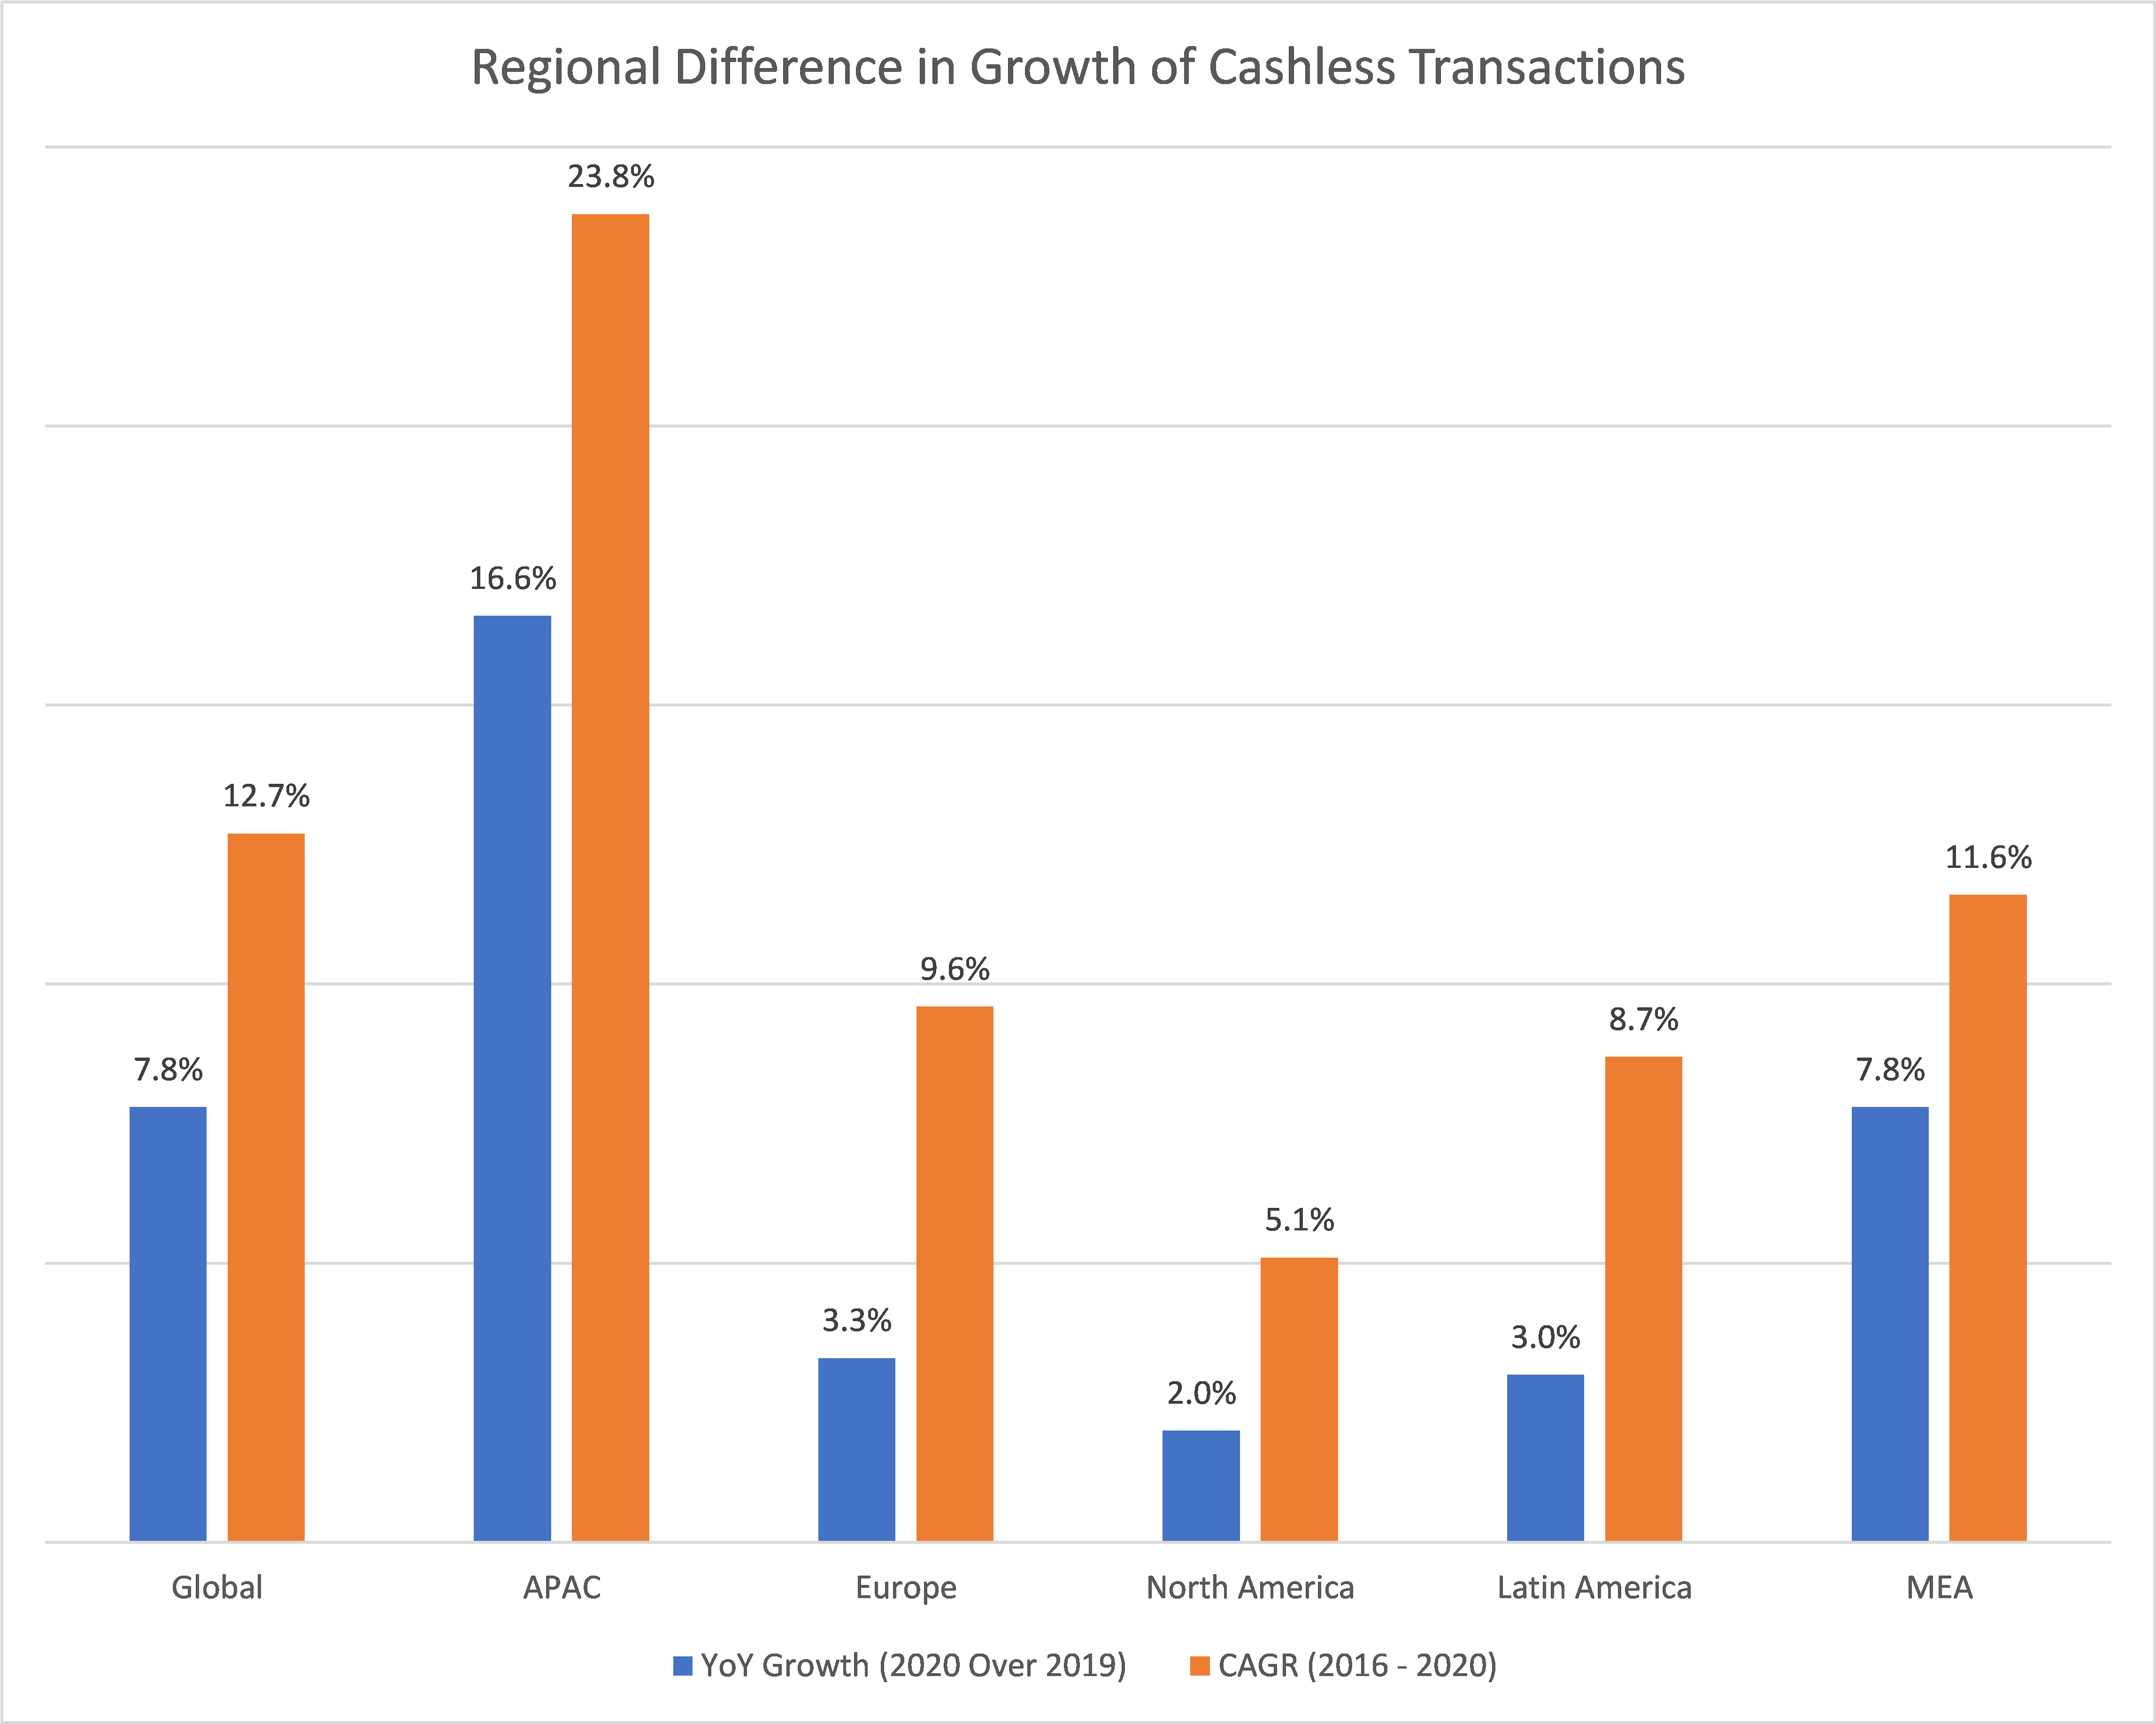
It is not hard to notice that such transactions in APAC grew at a higher than the global average in 2020, as shown in Exhibit 2. Non-cash transactions for APAC are projected to grow at a CAGR of 27.9% during 2020 – 2025. APAC is also likely to contribute to 56% of global non-cash transactions by 2025.
This meteoric rise of APAC in the digital payments arena has been fuelled by the unprecedented rise of internet connectivity in this particular region of the world and the boom in the smartphone market. This region also houses some of the manufacturing hubs of the global smartphone behemoth brands.
Exhibit 2
Source: Capgemini
Piggybacking on the rapid penetration of data connectivity coupled with the increased affordability of smartphones, the non-cash transactions market in this region is projected to grow by leaps and bounds. Tighter regulatory control to minimize the possibility of fraud has also given consumers the confidence to transact digitally without fear in a cyber-secure environment.
India at the forefront
A large part of this upward trajectory (in APAC) has been driven by India.
Right policy environment, improved data connectivity, wide availability of smartphones and tight regulatory controls put in place by RBI; all played a role behind the dramatic growth in cashless transactions in India. The demonetisation in 2016 made the nation “digitally ready”, well ahead of the pandemic. Regulators got due time to put in place measures to ensure the safety and security of digital transactions. The advent to e-retailers in every sphere of the economy provided consumers with opportunities to spend digitally.
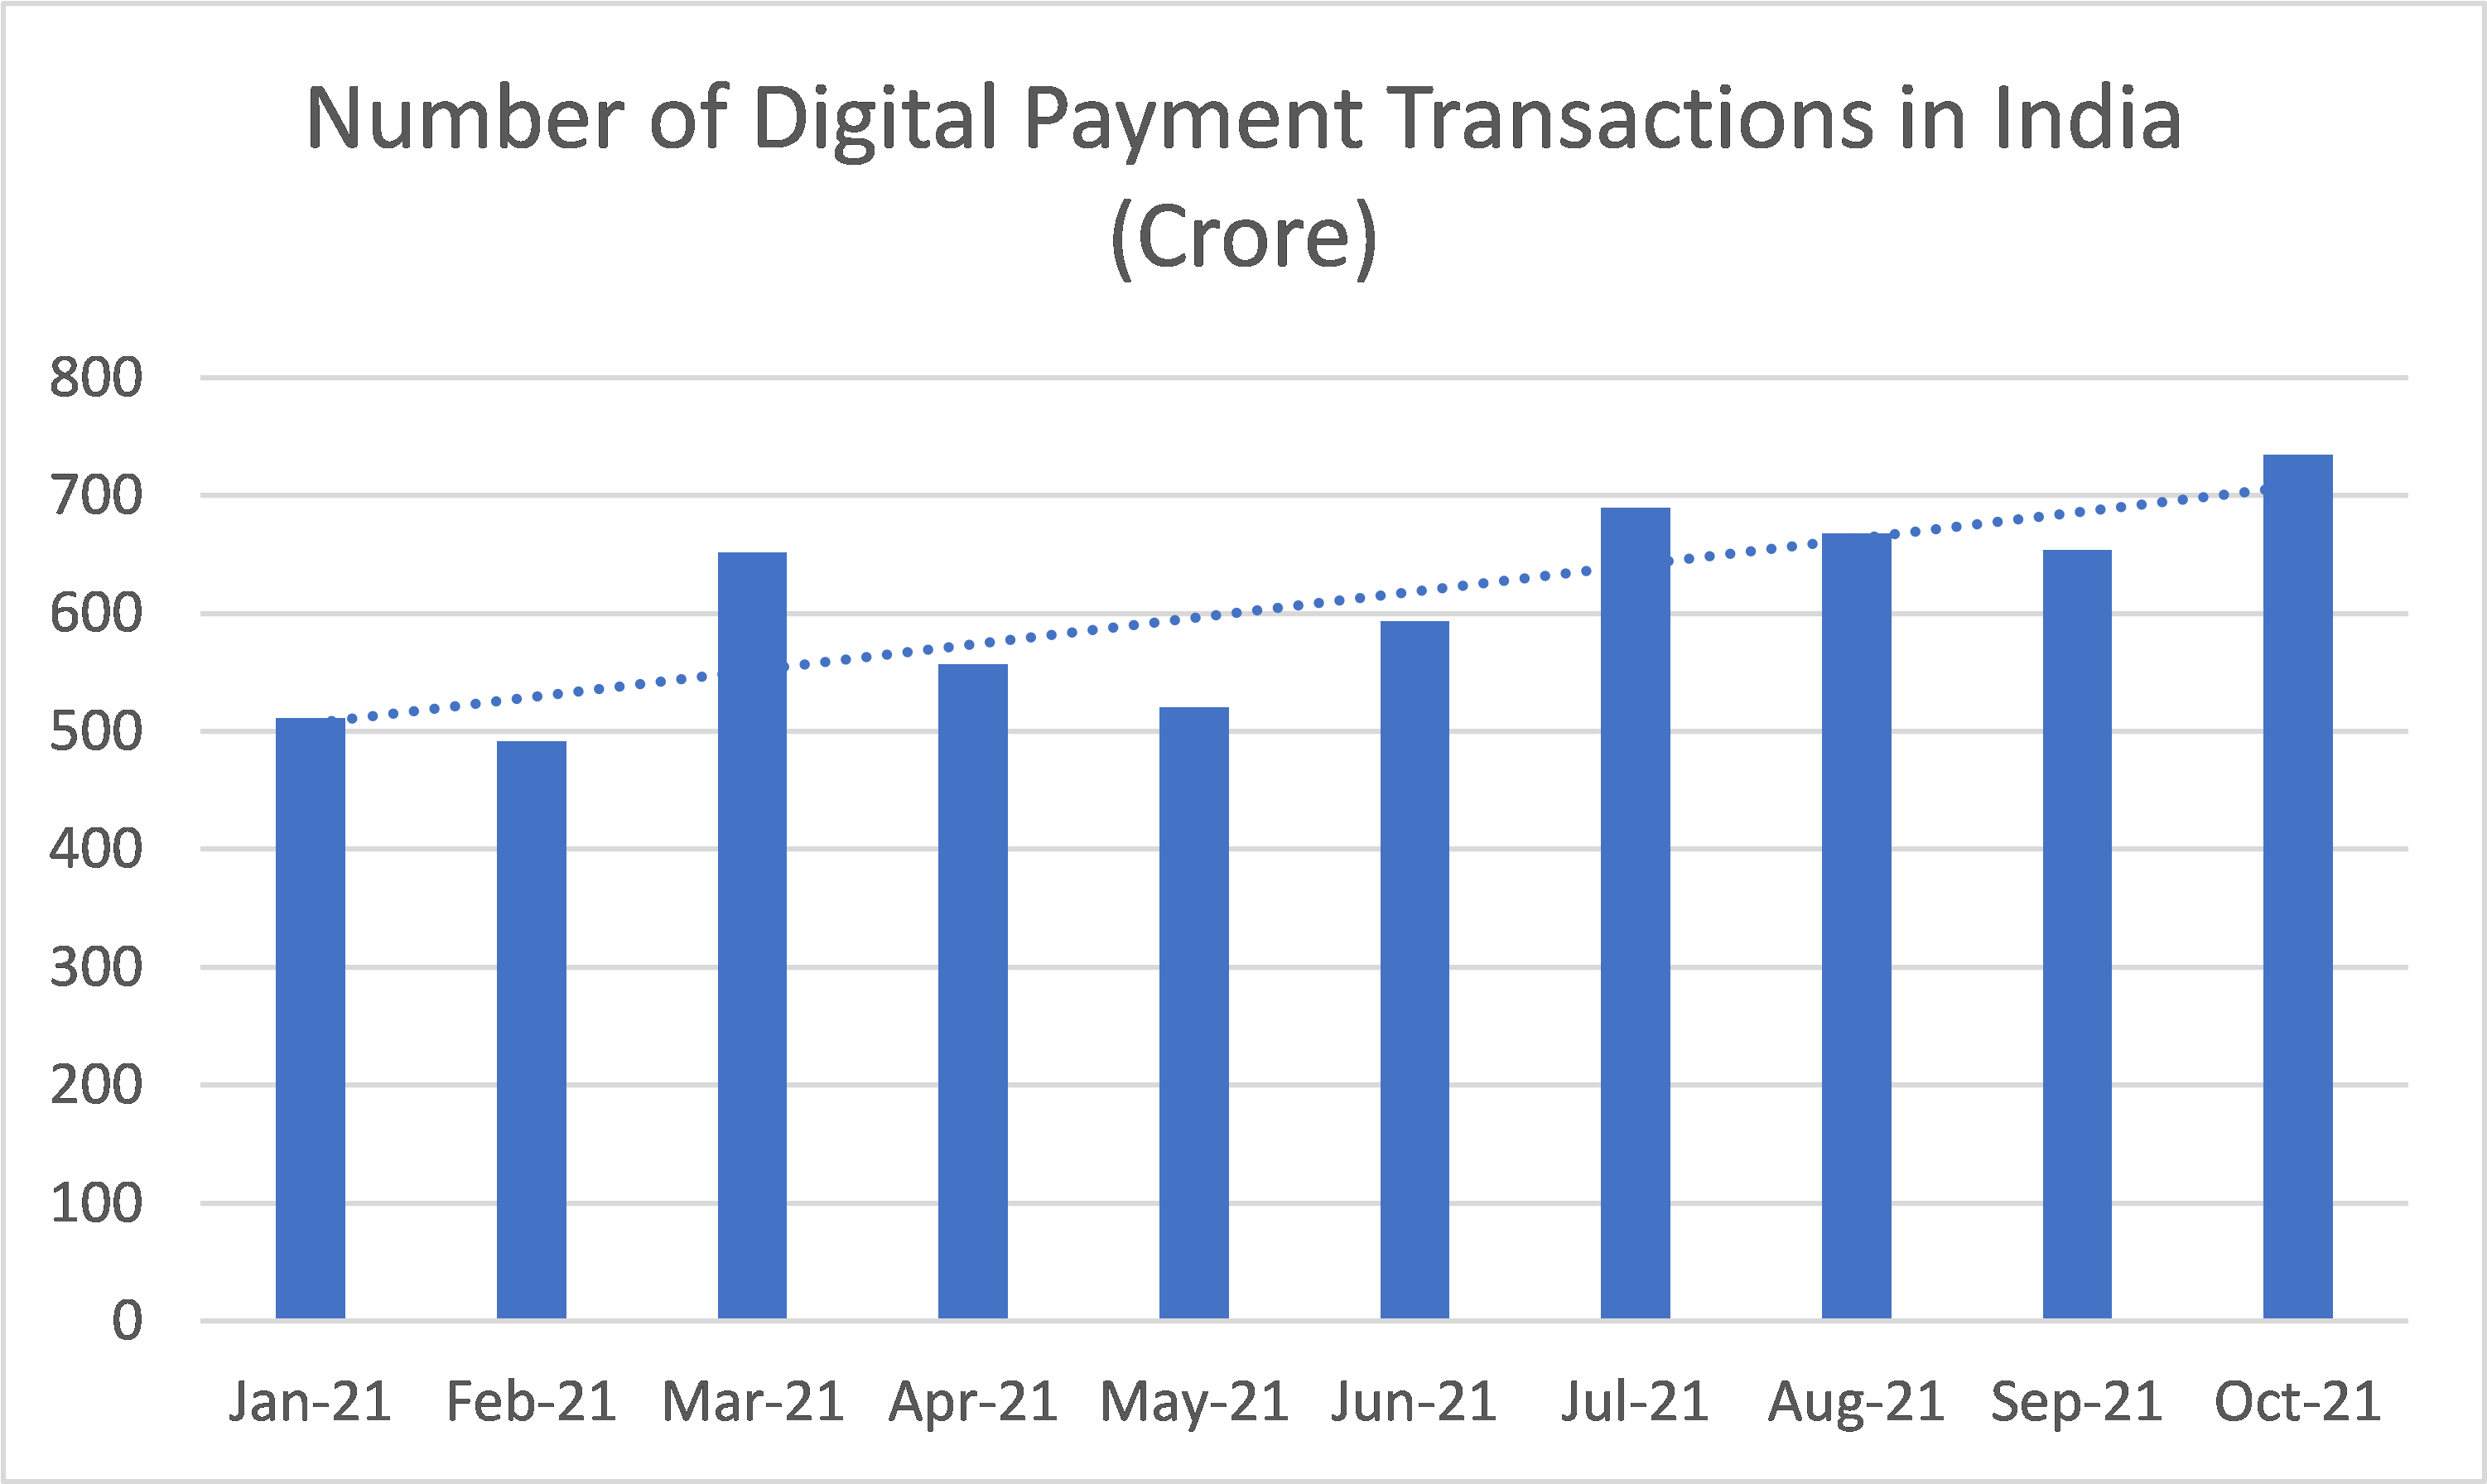
Exhibit 3 charts an overall rising trend of digital transactions in 2021. The trend is likely to strengthen with the gradual revival in economic activities.
Exhibit 3
Source: Digidhan Database, Government of India
Steps taken by the Government, to make digital payments easier and more cost-effective deserve a special mention. Earlier, the payment gateways being used for cashless transactions were not inherently indigenous and because of the lack of competition in that area, the fees for transactions were also high. This prevented many merchants from getting into the network.
A case in point here is card transactions. Although the systems and infrastructure for card payments had been set up in the country for some time, card transactions did not pick up to the extent that it was expected to. One of the reasons for this was the high interchange fees that were charged by card issuers to merchants. Merchants found it cost-effective not to accept such payments.
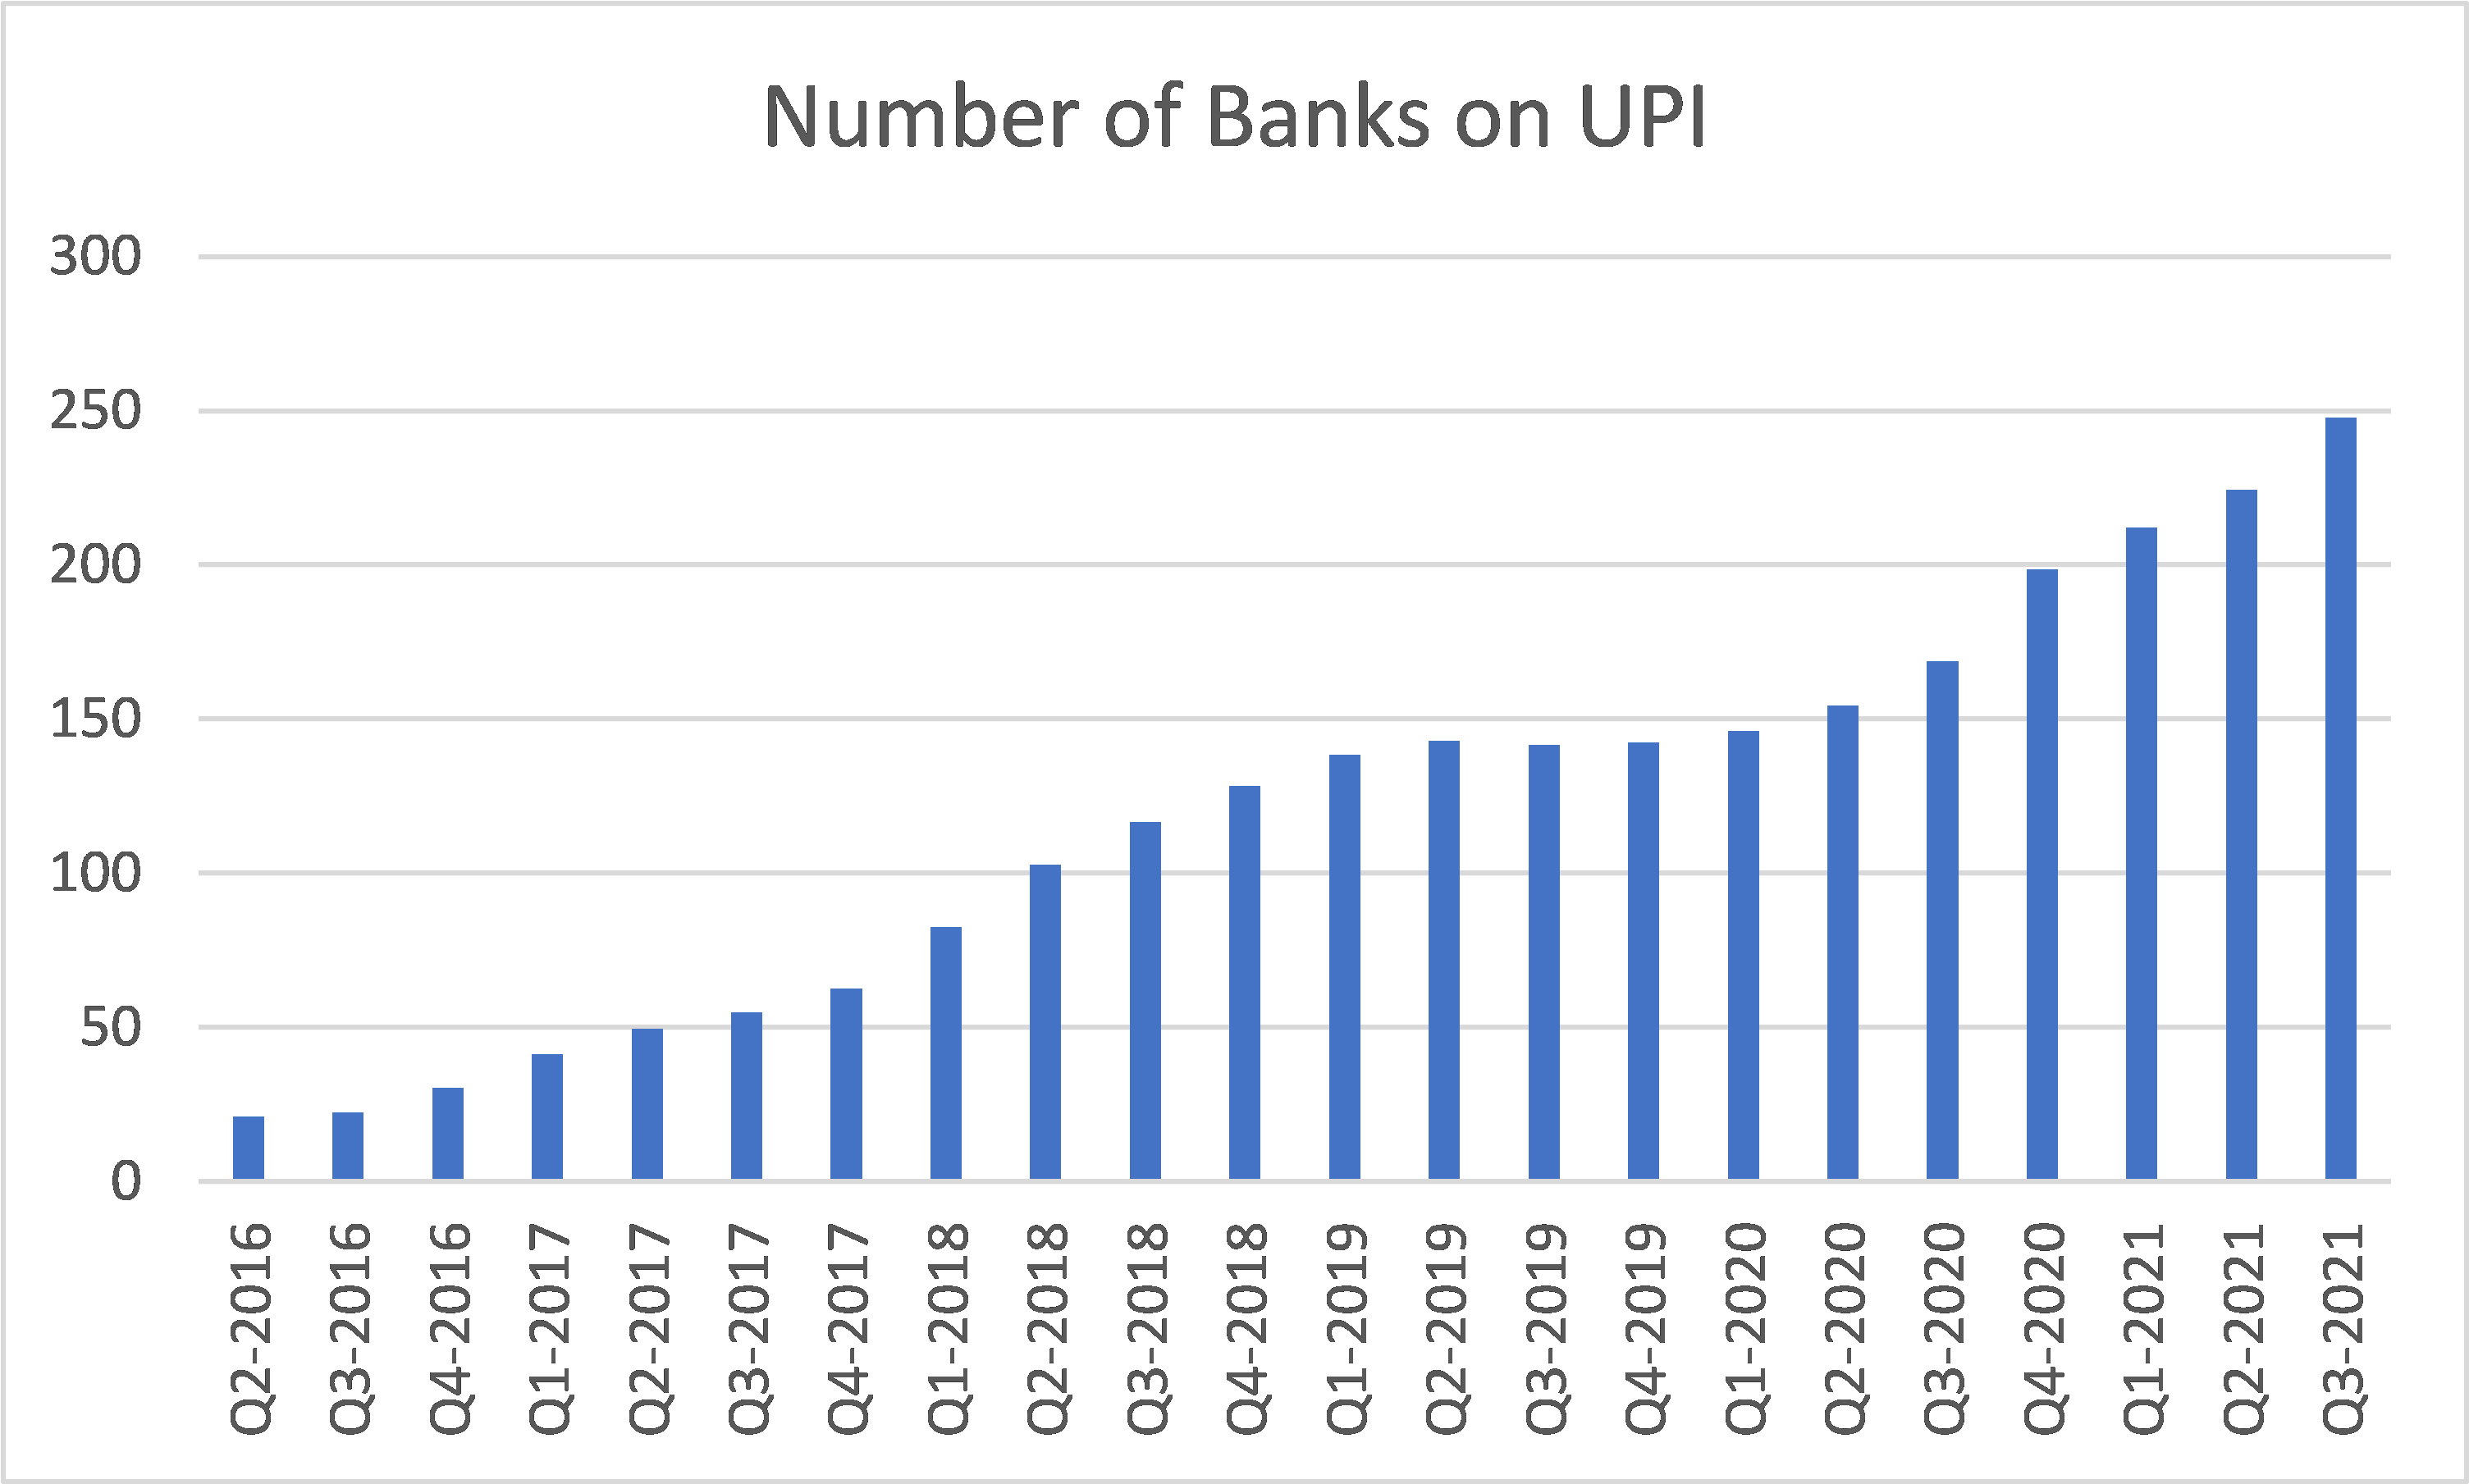
The Government’s launch and emphasis on the BHIM – UPI framework was a game-changer. The framework was an indigenous one and broke the monopolies. Fees came down drastically and all parties found it beneficial to become a part of the network. This trend is evident from Exhibit 4, which shows the number of banks on the UPI network over a period of time.
Exhibit 4
Data Source: National Payments Corporation of India
Digital payments rode this wave and increased by leaps and bounds. The acceptability of the UPI framework and the ease of transacting on the network coupled with the reduction in fees meant that there was no looking back and it also changed the fundamental way in which B2B and B2C transactions were undertaken.
The biggest attractiveness of the network lies in making small value transactions easier at no extra cost. The result is visible in Exhibit 5. Both the value and volume of digital transactions have grown manifold.
UPI has passed several significant milestones since its launch in 2016. It took nearly three years till October 2019, to cross the first billion-transaction mark. The next one billion transactions were achieved in less than a year. In October 2021 UPI transactions crossed the $100 billion mark for the first time, piggybacking on a surge in online shopping transactions during the festive season.
Exhibit 5
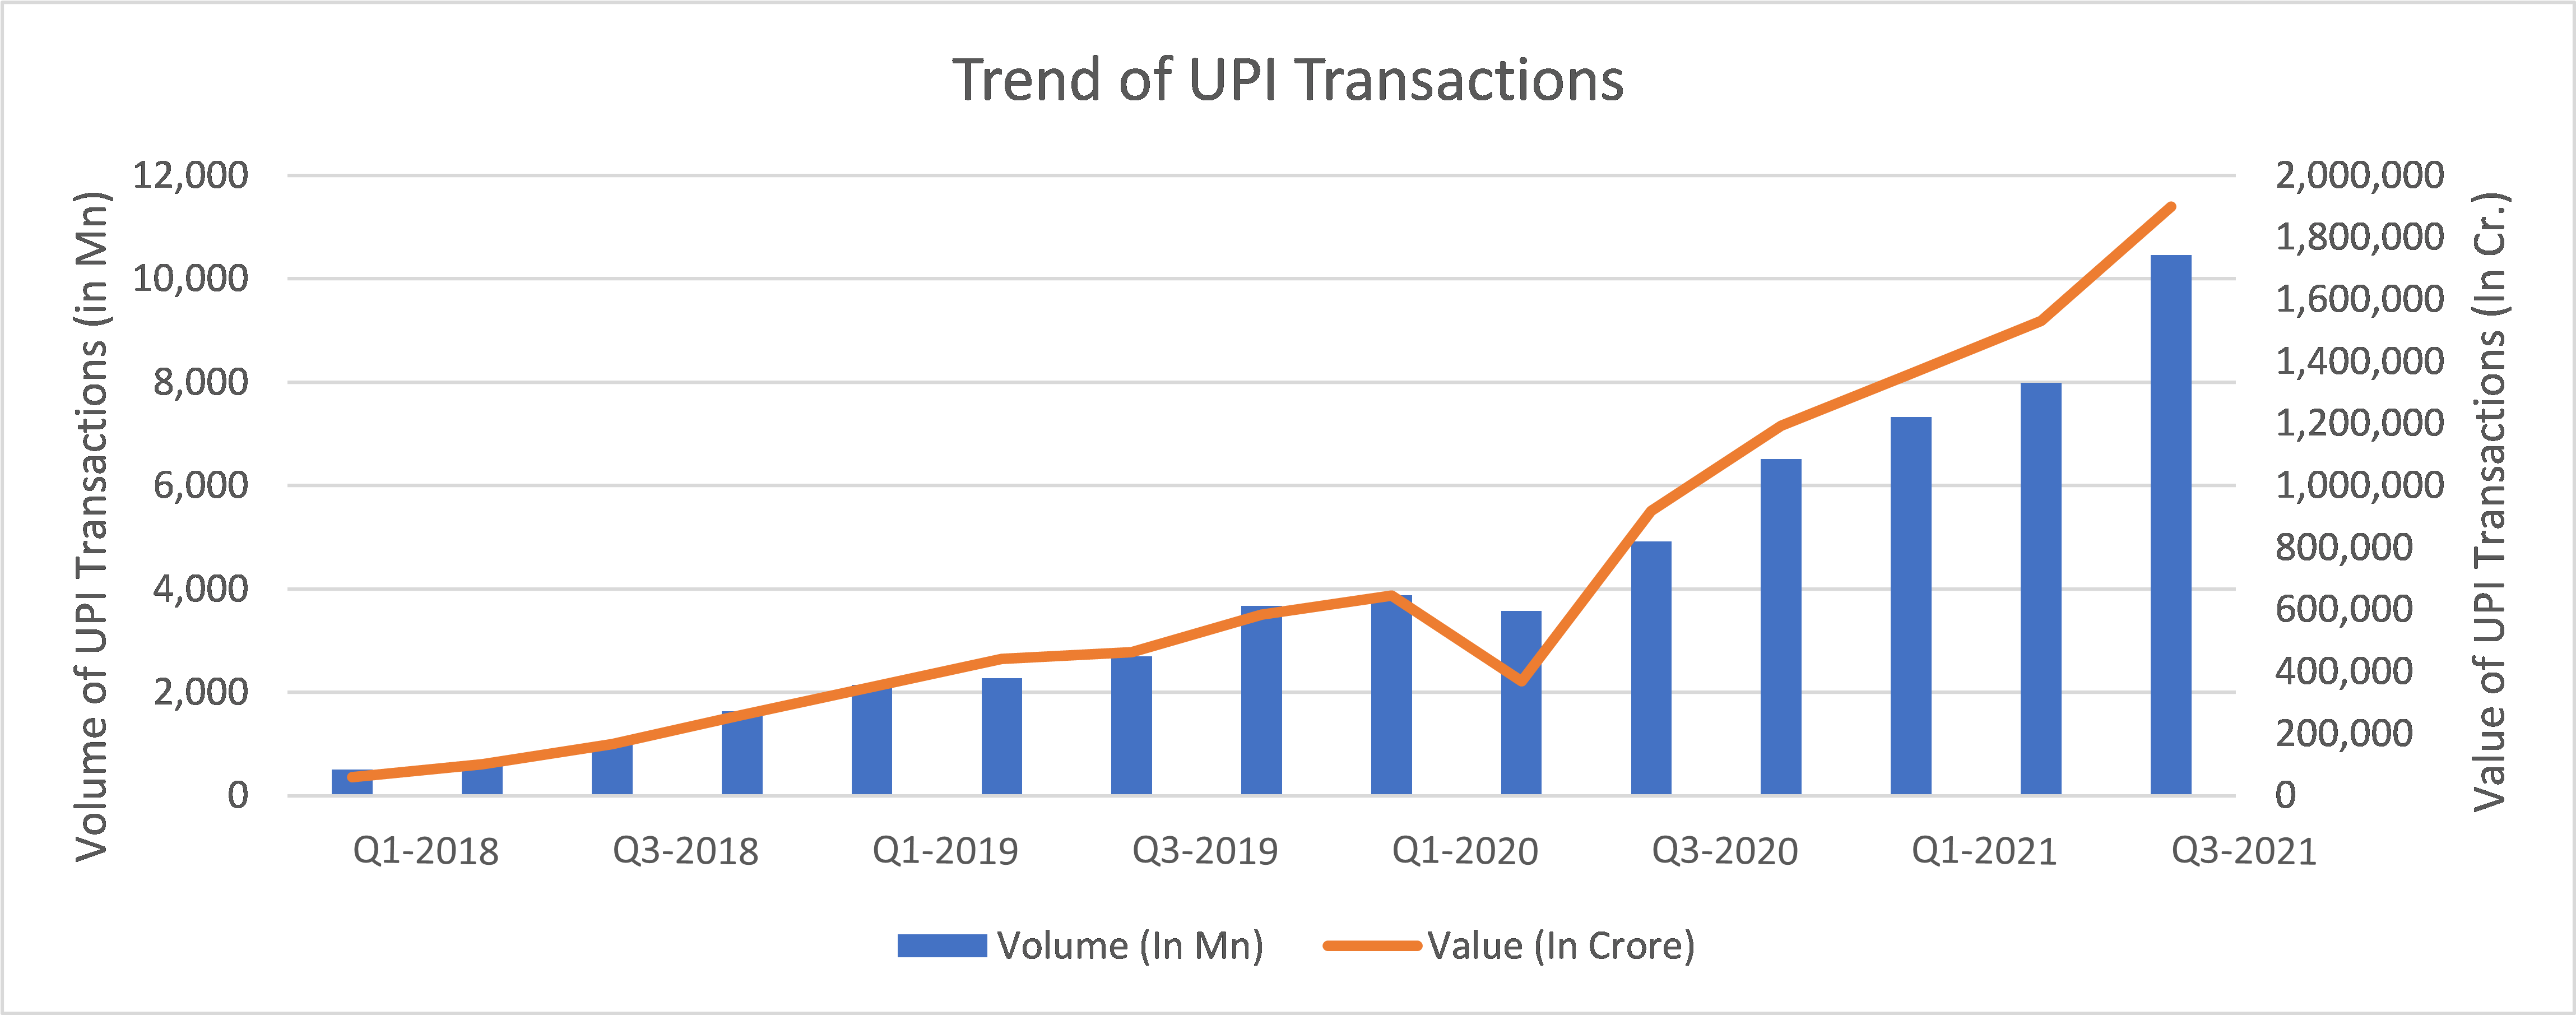
Data Source: National Payments Corporation of India
While the volume has grown across all states, there is a difference in the penetration of such payment methods across the country. As shown in Exhibit 6, digital payment is way above the national average in states like Chandigarh, Haryana, Uttar Pradesh and Karnataka. The All-India average stands at 5.0 digital payment transactions per capita per year with Chandigarh topping the charts at a whopping 38.5 such transactions.
At the other end of the spectrum, there are highly industrialised States like Tamil Nadu and Gujarat reporting way lower digital transactions per capita than the national average. Tamil Nadu is an auto and IT hub. Gujarat is the most industrialised State in India.
Exhibit 6
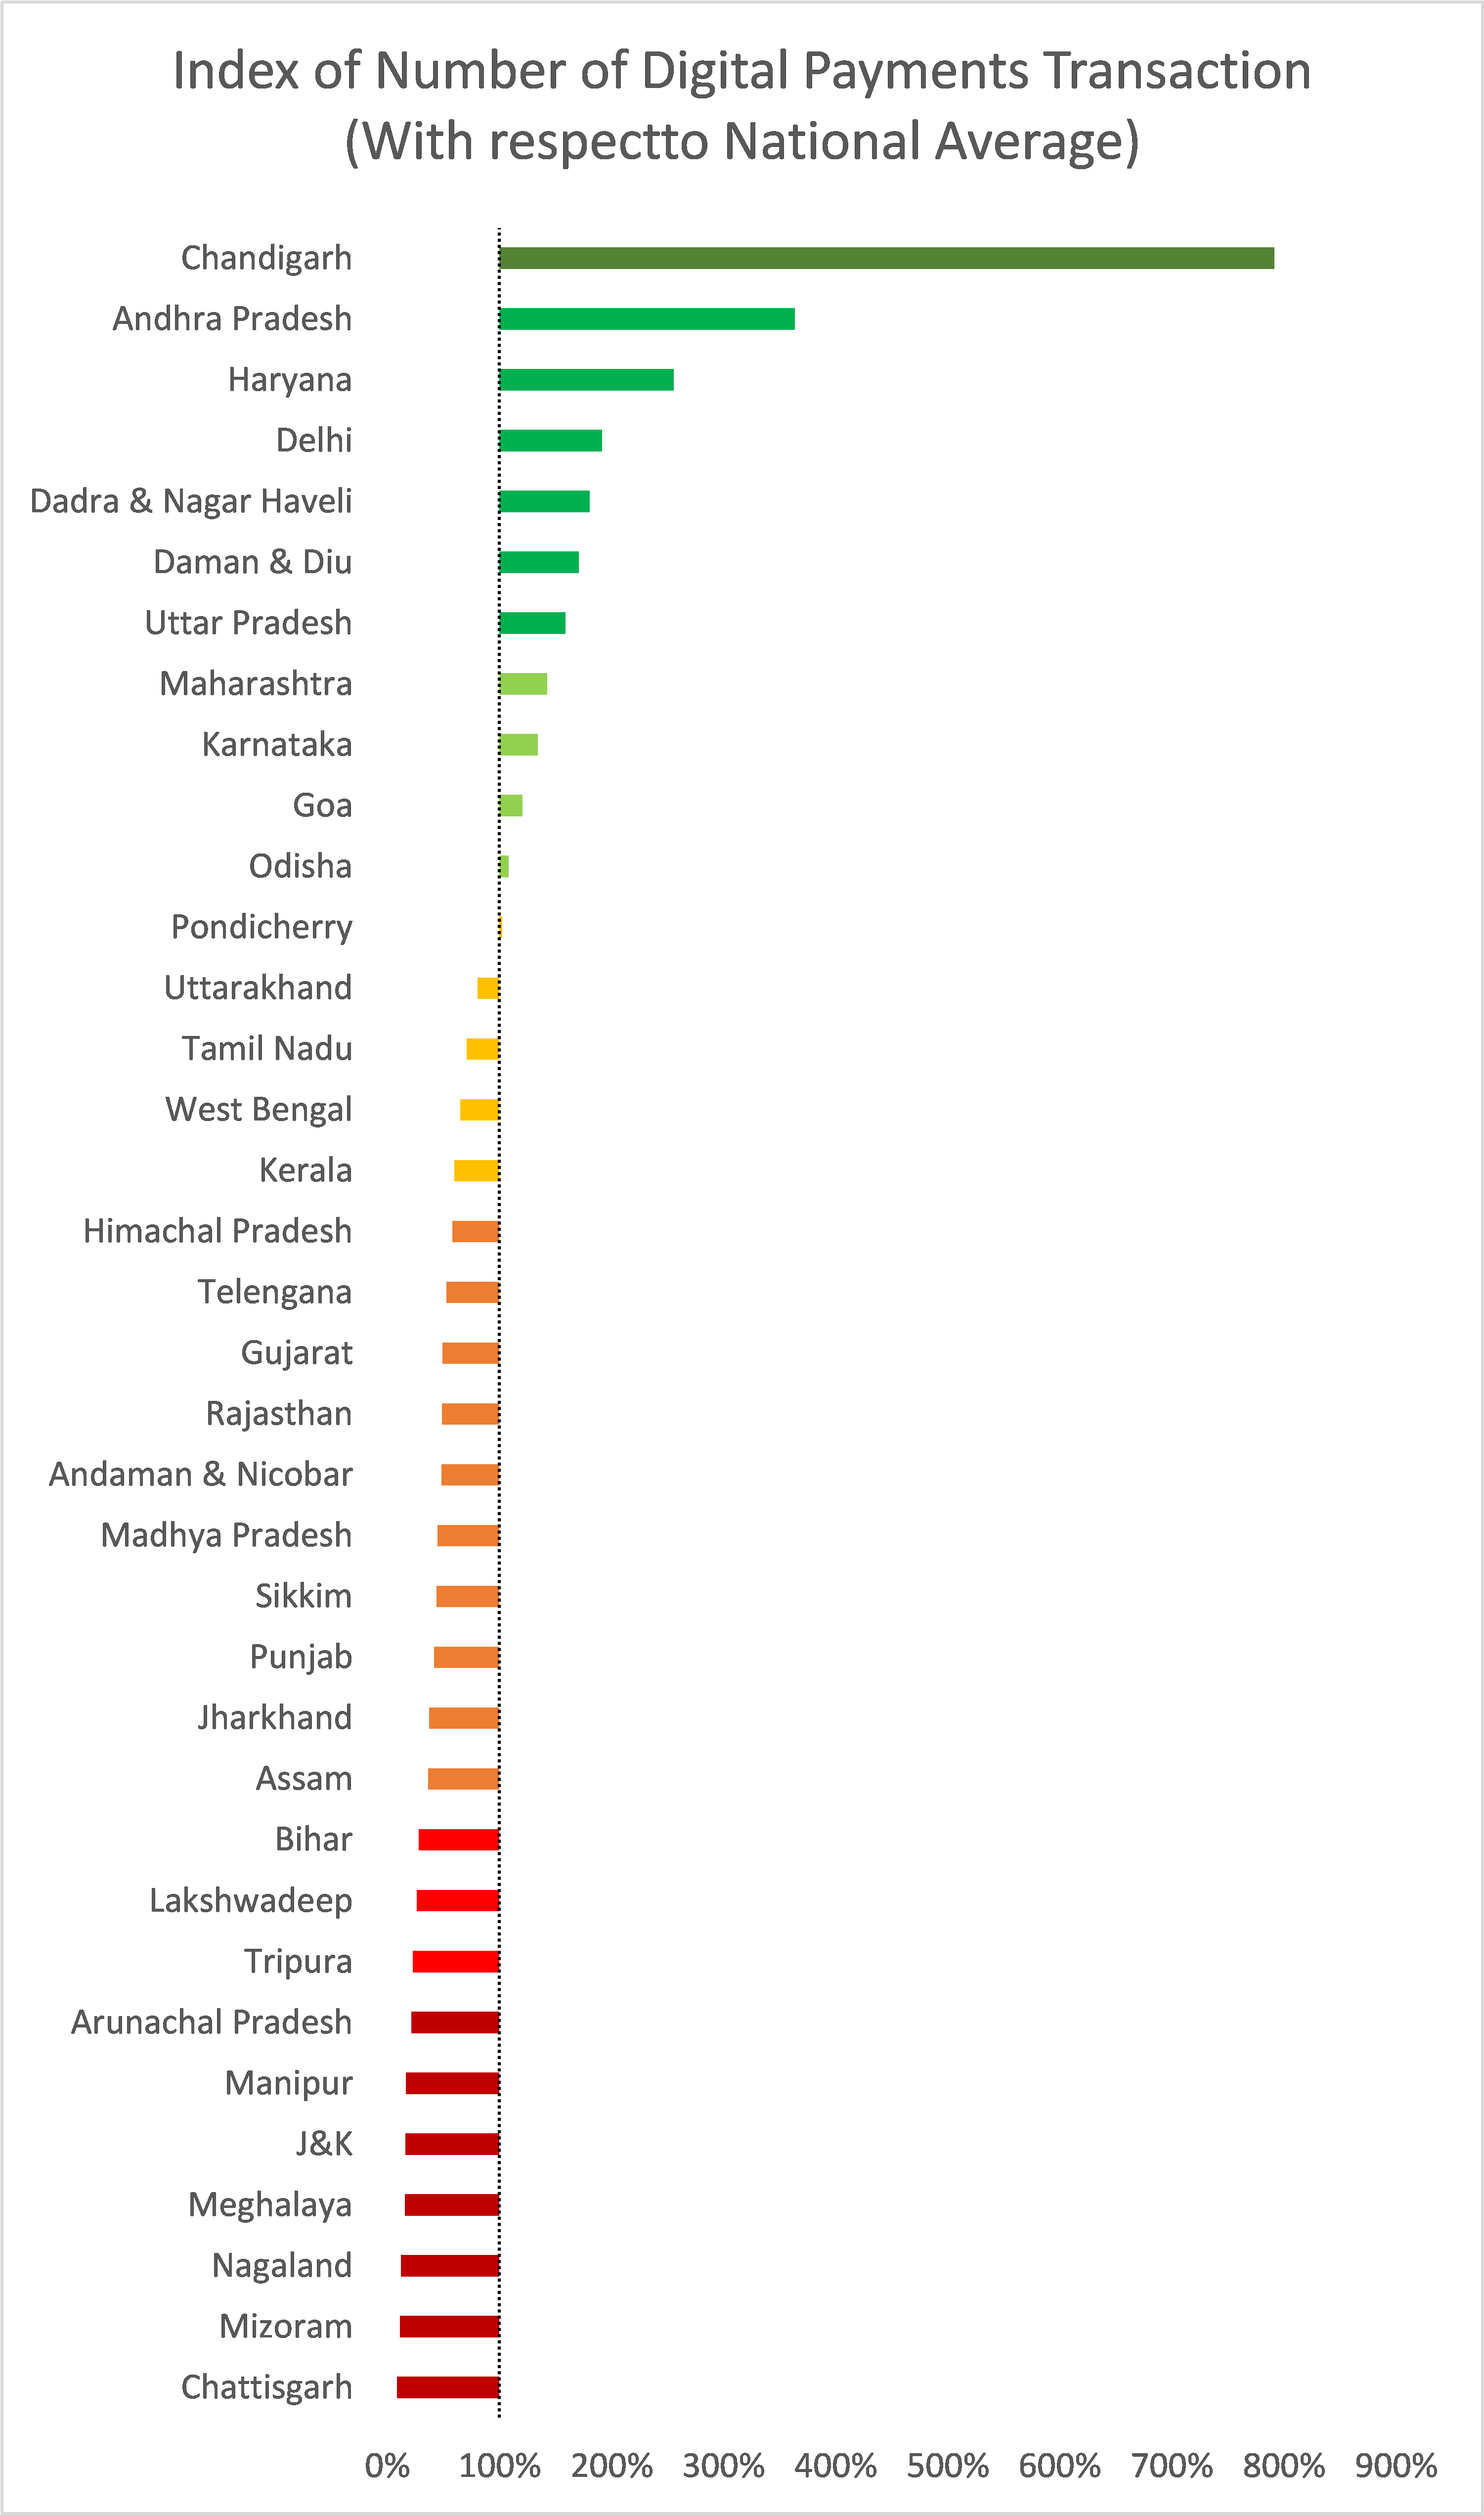
Source: Data from Digidhan Database, Government of India has been used in this analysis
Explaining this phenomenon is difficult. Industrially laggard West Bengal (3.2 transactions/capita/year) is distinctly behind its immediate neighbour Odisha (5.3 digital payment transactions/ capita/year) that too with a distinctly inferior internet penetration (Exhibit-7). Tamil Nadu is a top State in terms of internet penetration but below average in digital payment. Education is no benchmark either as Tamil Nadu and West Bengal both have large pools of educated populations.
Apparently, some States have a higher affinity to cash than others and/or some people are less comfortable in using digital payment options. It needs deeper study to correctly ascertain the reasons.
Exhibit 7
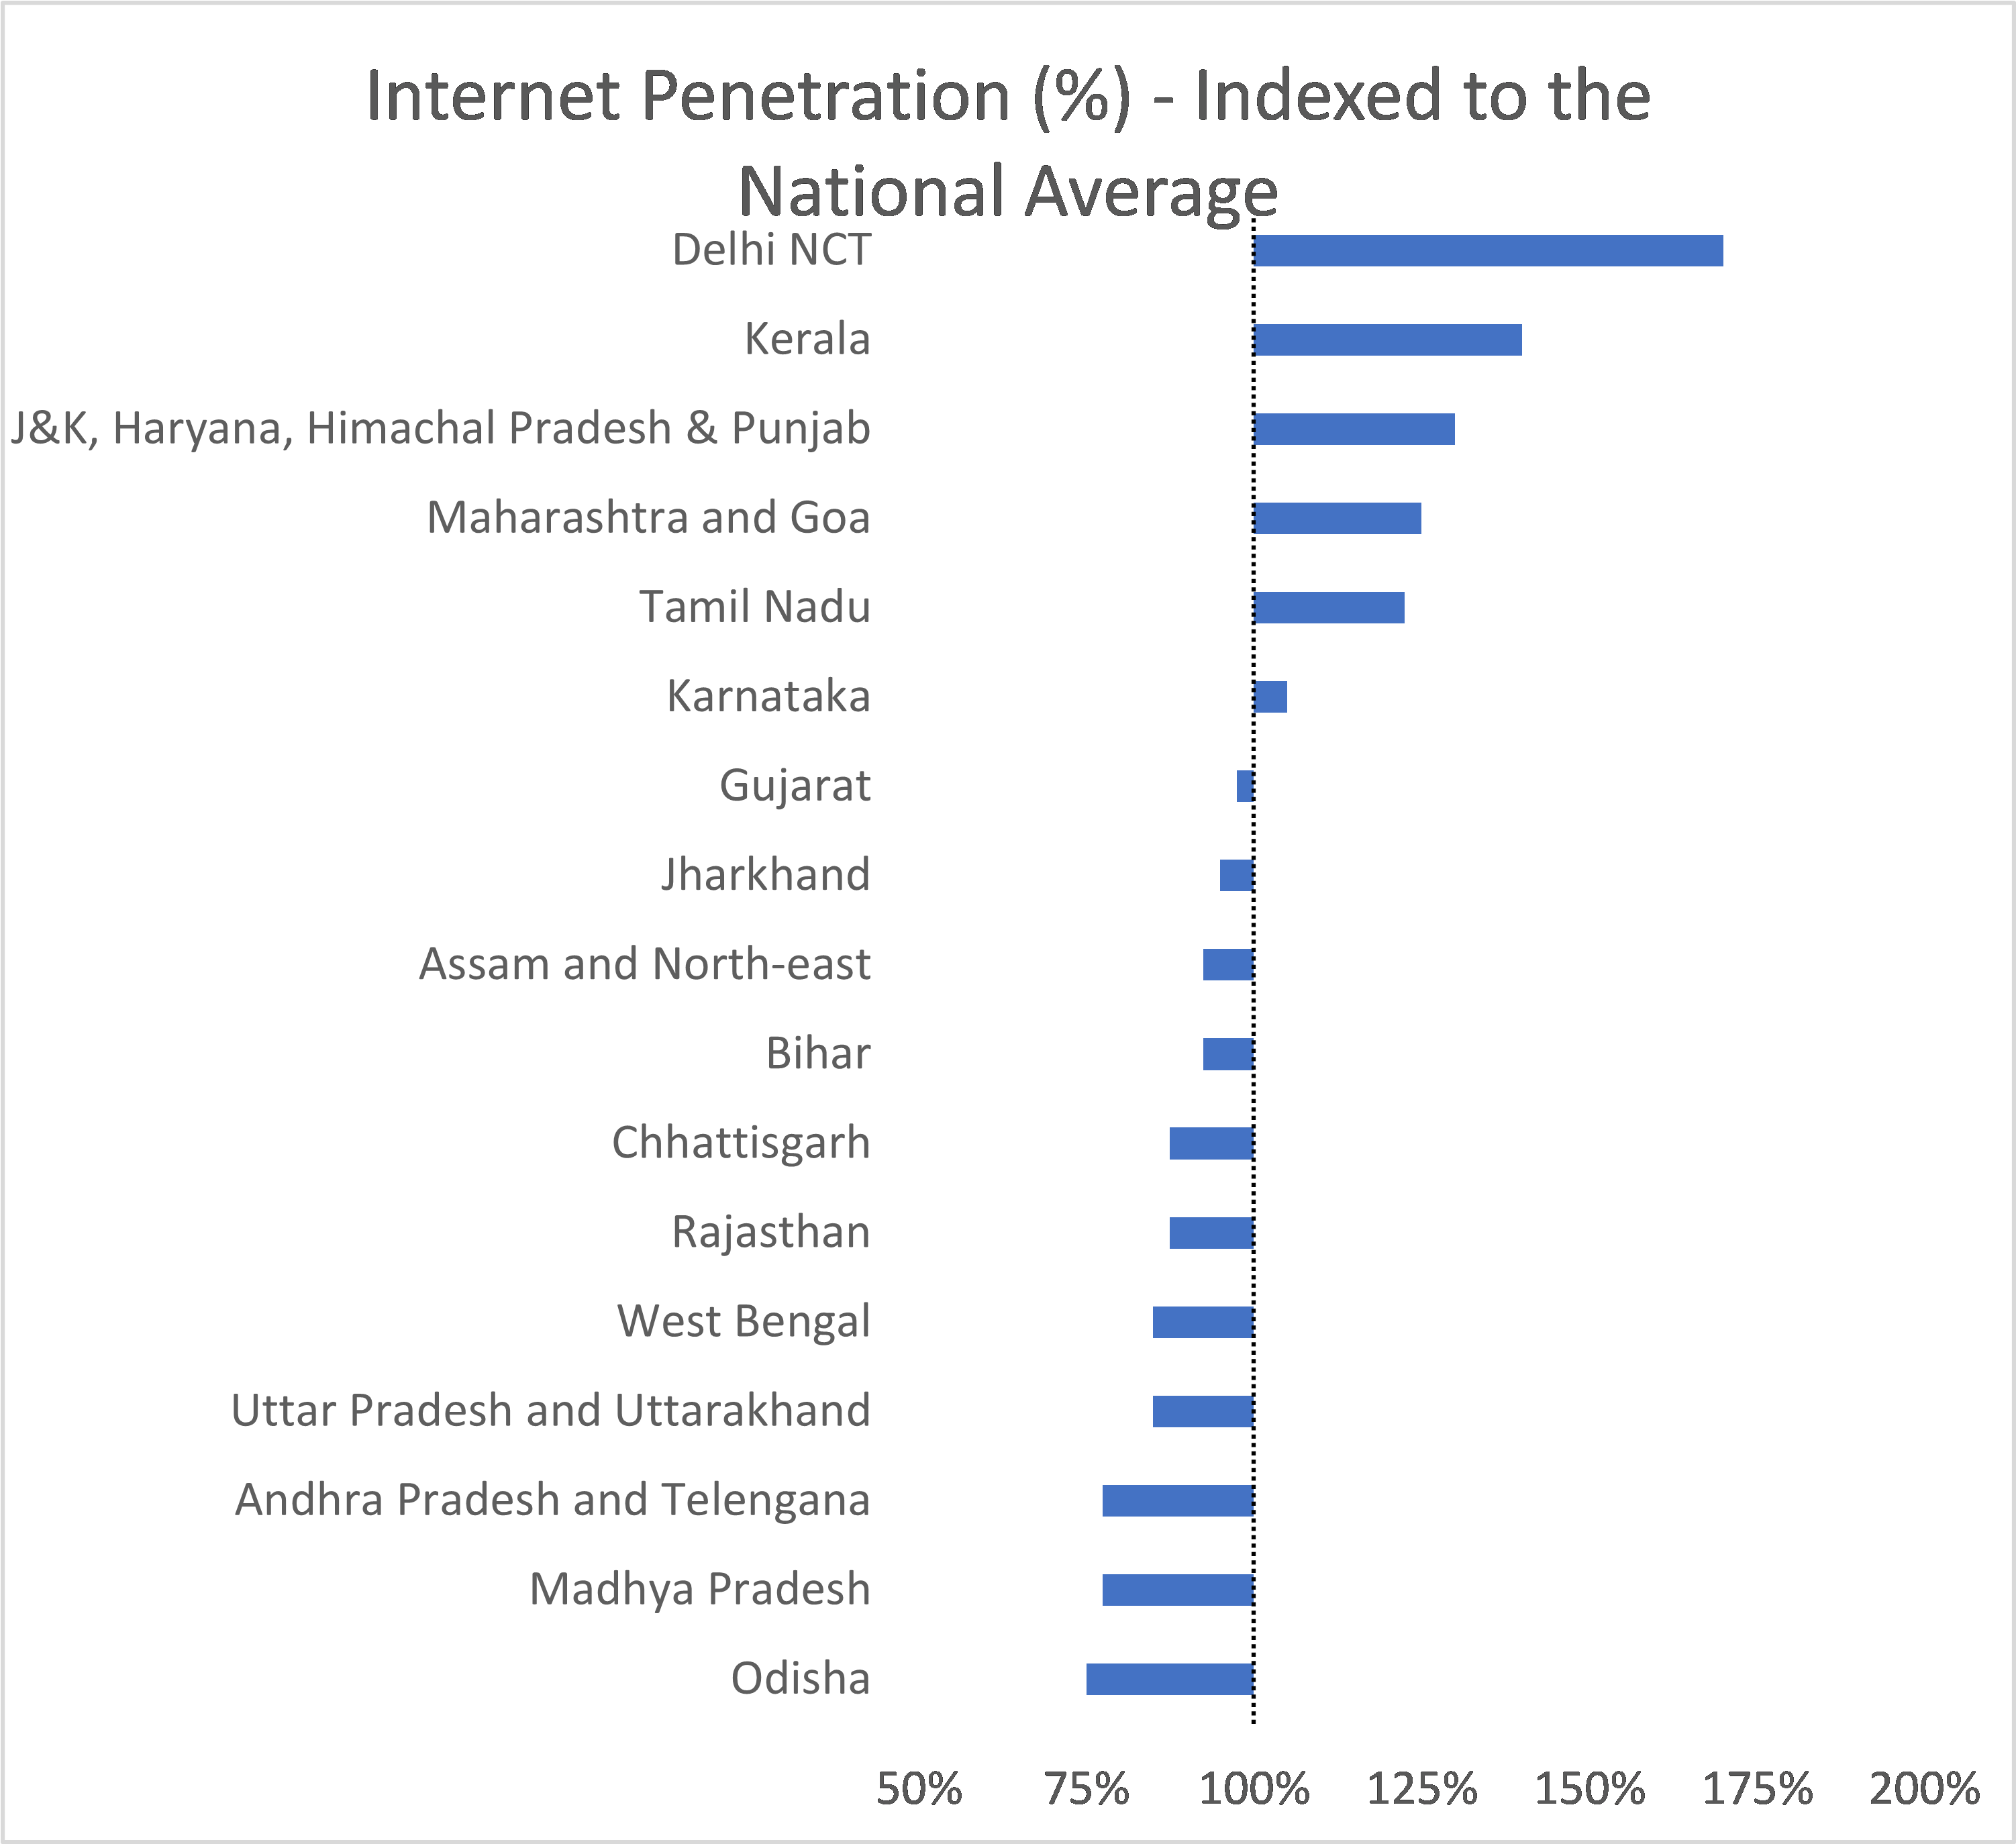
Source: Statista
*Bikram is an Analytics professional with an educational background in Economics. He also has a passion for everything that make human lives better.

123
2025-07-27 20:33:14

asd
2025-07-27 20:31:39
Northeast Energy Scenario Part-1: Paradigm shift in petroproduct availability and consumption
2023-03-28 16:22:05

Consolidation of 'indigenous' votes aligned Tripura's political landscape with the rest of the northeast.
2023-02-16 08:51:53

Why Kolkata doesn’t have a Unicorn ?
2023-01-28 09:53:57

Social media literacy should be mandatory in UG curriculum
2022-11-30 12:00:53
Iravati Research and Communication Centre LLP (IRCC) is a Kolkata-based think-centre, engaged in research and policy advocacy.
Copyright © 2020 - IRCC - All rights reserved. Developed by Thinkbizz Marcom PVT LTD
test
Votre remarque au sujet de la volatilité des jeux de table résonne. Ce qui importe vraiment dans ma pratique, c'est le contrôle financier et ma stratégie.